
Why good analytics starts with better questions
 Amrutha Gujjar••4 min read
Category: Guide
The problem with most analytics projects is that they start with the wrong question. People say, “We need a dashboard,” but that’s like saying, “We need a hammer,” without knowing what you’re building. Are you assembling a bookshelf? Constructing a skyscraper? Without clarity, you end up with the wrong tool for the wrong job.
Building good analytics requires understanding its purpose - what decisions it enables, who’s using it, and under what constraints. Analytics isn’t a single thing. It’s a spectrum, from simple dashboards to complex AI systems, and choosing the right type is half the battle.
🔍 Four Levels of Analytics
At its core, analytics is about answering questions. The sophistication of those questions defines the type of analytics you need.
1. What Happened? (Descriptive Analytics)
Descriptive analytics is the rearview mirror: it summarizes the past. Think dashboards showing last quarter’s sales or pie charts of user demographics. These are the bread and butter of analytics tools.
-
Why It Matters: Descriptive analytics sets the baseline. Without it, you’re flying blind.
-
Technical Insights:
-
The hardest part is often data cleaning. Your ETL pipeline needs to make sense of messy, siloed data.
-
Query performance matters less here; pre-aggregating data is often enough.
-
The mistake most people make is thinking this is where analytics ends. Descriptive tools are necessary but insufficient—they tell you where you’ve been, not where you’re going.
2. Why Did It Happen? (Diagnostic Analytics)
Imagine sales drop one month. Descriptive analytics tells you it happened, but diagnostic analytics digs into why. It’s the difference between knowing your car broke down and understanding it was because the oil ran out.
-
Why It Matters: Without diagnostic tools, you’re guessing at solutions.
-
Technical Insights:
-
Flexibility is critical. Users need to slice data across unexpected dimensions: by region, by product line, by time.
-
Interactivity becomes a requirement. If the user clicks on a metric, they should instantly see what’s driving it.
-
The mistake here is overloading the user with options. The best diagnostic tools guide users toward insights without drowning them in data.
3. What Will Happen? (Predictive Analytics)
The rearview mirror only gets you so far. Predictive analytics is the windshield: it uses historical data to forecast the future. Whether you’re predicting demand or spotting churn risks, the goal is to see ahead.
-
Why It Matters: Businesses that anticipate problems outperform those that react to them.
-
Technical Insights:
-
Building models is easy. Maintaining them is not. Your data pipelines need to support retraining and deployment at scale.
-
Explainability is key. Users need to trust the predictions, which means showing them why a model made a certain call.
-
The biggest mistake here is chasing complexity. A simple, well-explained prediction often outperforms a black-box model no one understands.
4. What Should We Do? (Prescriptive Analytics)
Predictive analytics tells you what might happen. Prescriptive analytics tells you what to do about it. This is the pinnacle of analytics: not just insights, but actions.
-
Why It Matters: Without action, insights are useless.
-
Technical Insights:
-
Integrations are crucial. Prescriptive systems need to plug into operational tools to automate decisions.
-
Users need "what-if" modeling to explore trade-offs. For example, “What happens if we move inventory from Store A to Store B?”
-
The danger here is oversimplification. Users don’t want to be told, “Do X.” They want to see why X is the right choice, and what happens if they choose Y instead.
👥 Who’s Using This?
Analytics tools fail when they don’t consider the audience. A marketer, a data scientist, a customer, and an executive all want different things from the same dataset. Here are the three major categories of users:
▪️Self-Serve Analytics
These are tools for non-technical users: marketing managers tracking campaigns, sales teams monitoring pipelines. The goal is independence.. letting users get answers without needing analysts. The best tools feel effortless.
-
Key Features:
-
Drag-and-drop interfaces.
-
Pre-built templates for common questions.
-
Guardrails to prevent mistakes (e.g., role-based permissions).
-
▪️Internal Analytics
This is analytics for internal teams: finance, operations, product. These users are savvier, and their needs are more complex. A CFO doesn’t just want revenue numbers; they want to break them down by region, compare them to forecasts, and share insights with the board. Internal analytics lives and dies by data accuracy. A single bad number can destroy trust.
-
Key Features:
-
Custom metrics and dashboards.
-
Integration with internal tools (e.g., CRMs, ERPs).
-
Collaboration features: shared dashboards, annotations, and alerts.
-
▪️External (Customer-Facing) Analytics
External analytics is what you build for your customers. If you’ve used a SaaS platform with a “Usage Stats” dashboard, you’ve seen it in action. Here, analytics isn’t just a tool—it’s part of your product. If your analytics go down, your customers will notice
-
Key Features:
-
White-labeling to match customer branding.
-
Scalability to handle thousands (or millions) of users.
-
Security features like tenant isolation
-
⚙️ What Job Does Analytics Do?
Analytics also varies by its function. Are you optimizing supply chains or forecasting revenue? Here are a few key types:
-
💰 Financial/Revenue Analytics: Budgeting, forecasting, and ROI tracking. High precision is necessary
-
🎯 Sales/Marketing Analytics: Tracking sales performance, ad spend and conversions across channels.
-
🔦 Behavioral Analytics: Understanding user interactions and flows. Fine-grained event tracking.
-
🌍 Geo-Spatial Analytics: Analyzing data by location. Support for massive datasets and spatial queries.
-
🛠 Operational Analytics: Real-time monitoring for running the business. Think dashboards for warehouse efficiency or website uptime.
The Many Faces of Analytics Delivery
Imagine you’re designing an analytics system. The data is ready, the users are eager, but the next question is how to deliver it. The method of delivery is deeply tied to the problem you’re solving. Are users embedding analytics into a product? Are they looking for real-time insights? Or are they working with large datasets in chunks? Let’s break it down.
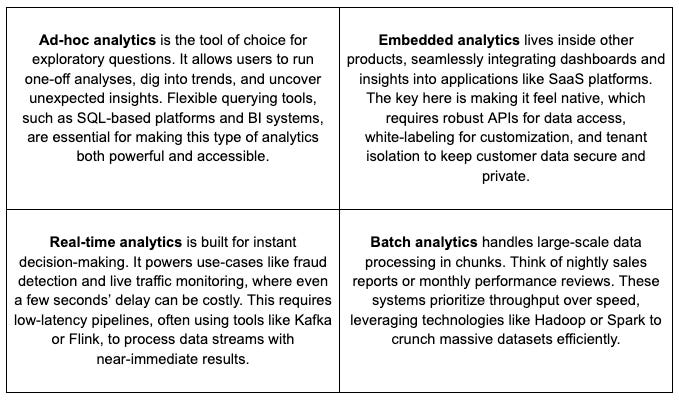
These methods, embedded, real-time, batch, and ad-hoc, aren’t mutually exclusive. Many systems combine them, layering real-time alerts on top of batch-processed reports or embedding ad-hoc tools into SaaS products. The key is understanding the job at hand and designing the delivery method to match.
Takeaways
Choosing the right analytics tool is all about fit. Before building or buying, ask:
-
Who are the users? What’s intuitive for a marketer might frustrate a data scientist.
-
What’s the job? Monitoring, diagnosing, predicting, or prescribing?
-
What are the constraints? Real-time data? Massive scale? Strict compliance?
Analytics isn’t a tool. It’s a set of questions. The clearer you are about the questions you’re answering, the better your solution will be. The worst analytics tools try to do everything; the best do one thing exceptionally well.
Clarity beats complexity. In analytics, as in life, knowing what you’re solving for is half the battle.
Try Preswald today!

